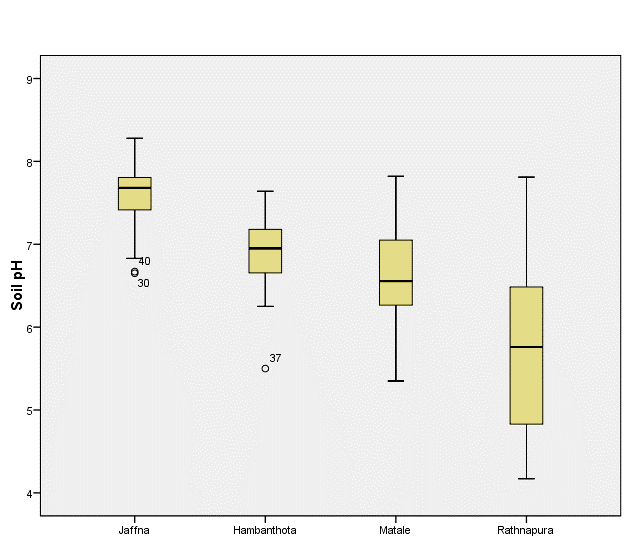
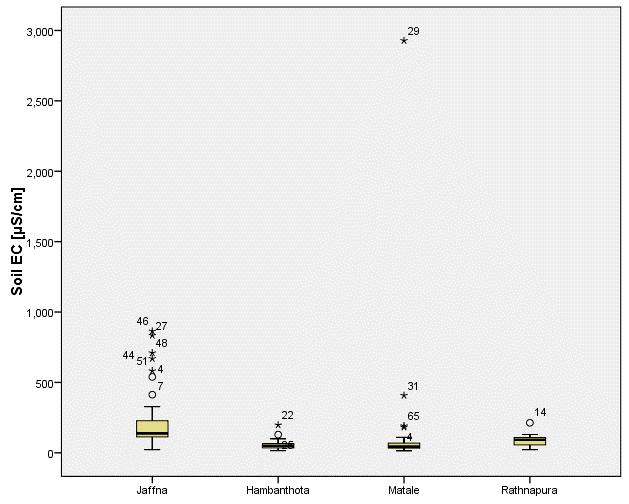
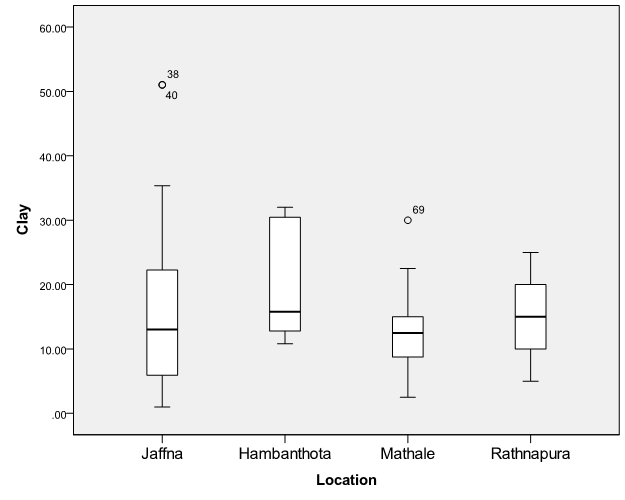
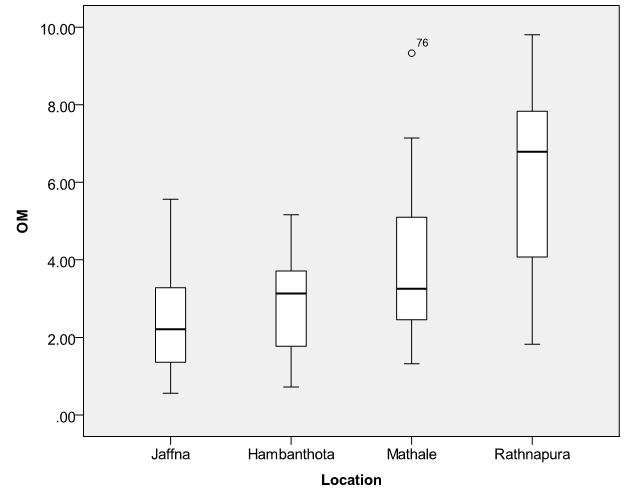
Soil analysis Soil Quality Assessment in the Homegardens Figure 1: Variability of soil pH of homegardens soils collected from four locations Figure 2: Variability of soil EC of homegardens soils collected from four locations Figure 3: Variability of percentages of clay of selected homegardens soils collected from four locations Figure 4: Variability of percentages of organic matter of selected homegardens soils collected from four locations Table 1: Populations of culturable fungi and bacteria of disturbed soil samples collected from four locations after few days of rain Location Initial sampling fungi (CFU / g soil) bacteria (CFU / g soil) Jaffna 4.42 x10² 3.5 x10⁴ Matale 9.6 x 10⁴ 7.8 x10⁸ Hambantota 8.73 x10³ 6.8 x10⁶ Ratnapura 3.6 x 10⁴ 10 x107